ALEPH tutorial
Aims of the tutorial
In this tutorial, we will show how to execute ALEPH from the command line. Alternatively, its graphical interface allows to run the same operations directly:
- Annotate a model
- Decompose a model
- Generate a library from a fold
- Superpose a fold onto a complete structure
Data tutorial
The model used in this tutorial to exemplify annotation and decomposition is Catechol O-Methyltransferase from R. norvegicus (PDB id 1VID). To illustrate the generation of a library of models with a common fold, a template cut from 1VID (1VID_2ah_4bs.pdb) is used. A set of 140 models (homologs_1VID) is used as the database directory. Finally, the PDB structure 5EZU is used as the reference on which a fragment of the model 1WPV is superposed. All required files can be downloaded here.
Step by Step tutorial
1- Annotate a model
The model will be annotated with default strictness thresholds.
Execution
To execute ALEPH from the interface:
ALEPHUI
You can also run the program from the command line, interactively or in the background, saving the terminal output to a log file.
1. Interactively:
ALEPH annotate --pdbmodel 1VID.pdb --strictness_ah 0.5 --strictness_bs 0.3
2. In background:
ALEPH annotate --pdbmodel 1VID.pdb --strictness_ah 0.5 --strictness_bs 0.3 >& logfile.log &
Output and results
The annotated model is written into a file called 1VID_input_search.pdb. This file contains a header with the helix/sheet record and the coordinates for atoms belonging to alpha helices or beta strands. It follows the pdb file format convention and can be displayed in a visualizer (Figure 1).
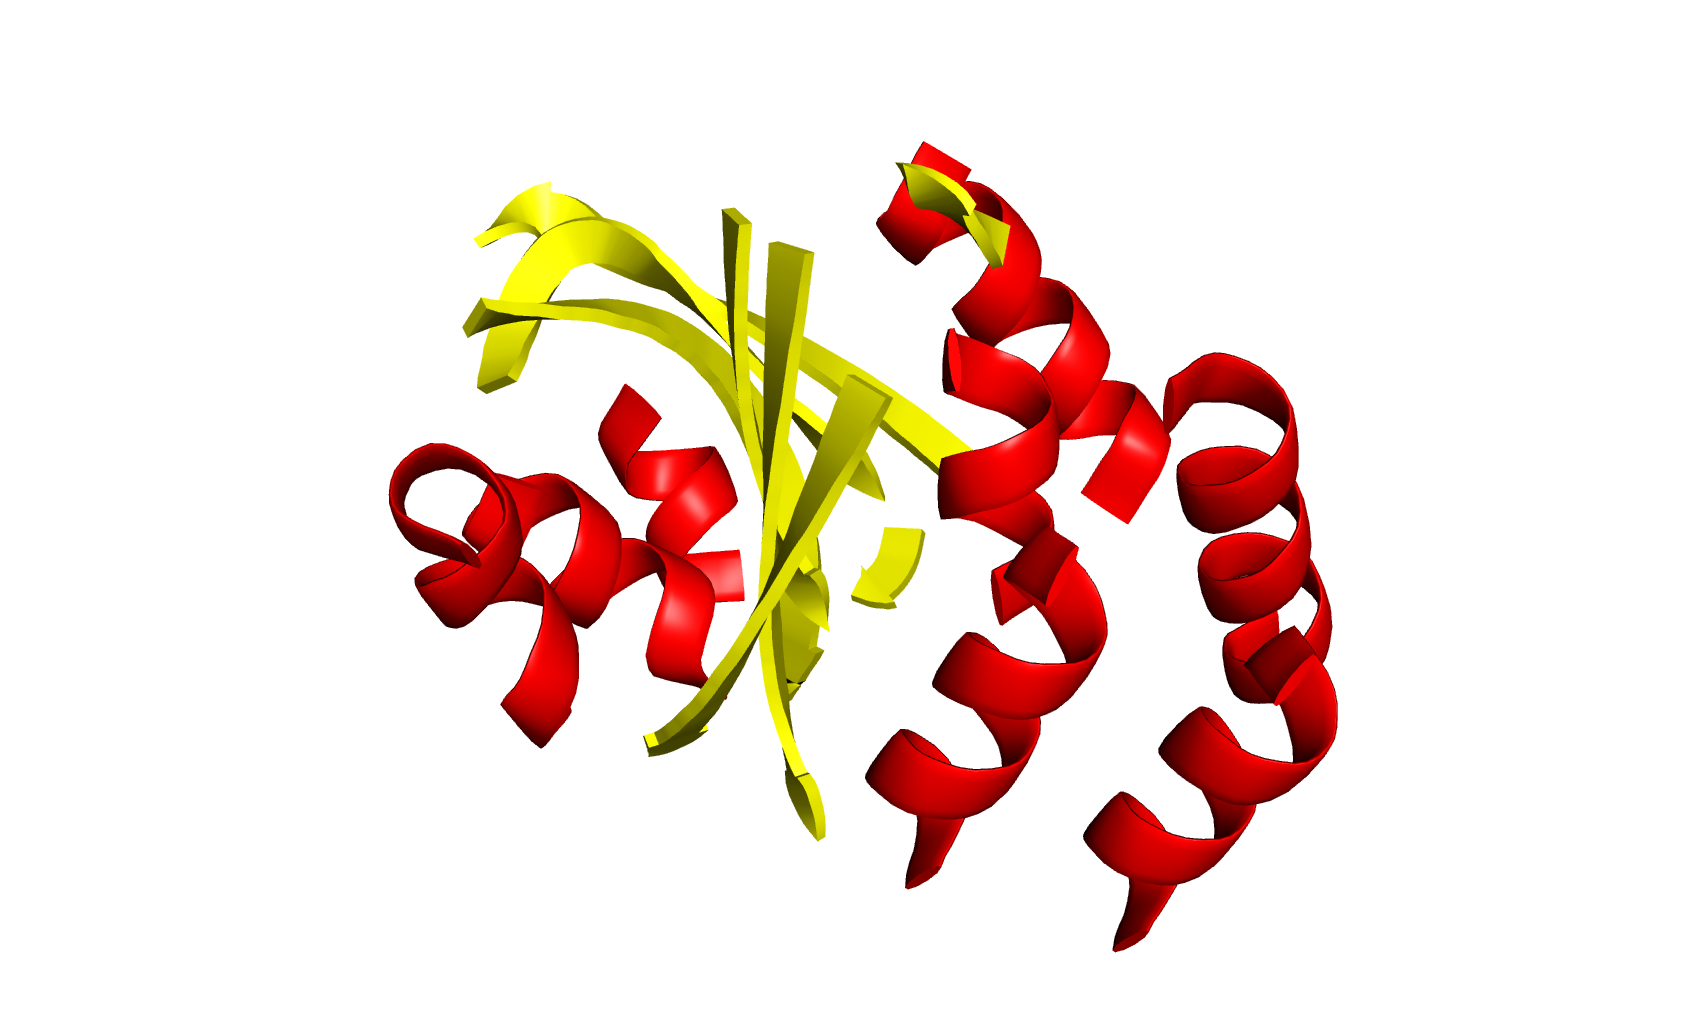
Figure 1. Model 1VID is displayed as annotated by ALEPH. Secondary structure elements are shown in different colours: red for alpha helices and yellow for beta strands.
Geometrical properties of the CVs are plotted in .pgn files: CVLs.png shows the distribution of the length of CVs; Angles.png and Angles2.png, distribution of the angles of CVs in the kind of plots displayed in figure 2. linear plot and circular plot respectively and ca-ca_d.png, the distribution of the distances between Cα. These plots can be visualized in the advanced tab of ALEPHUI.
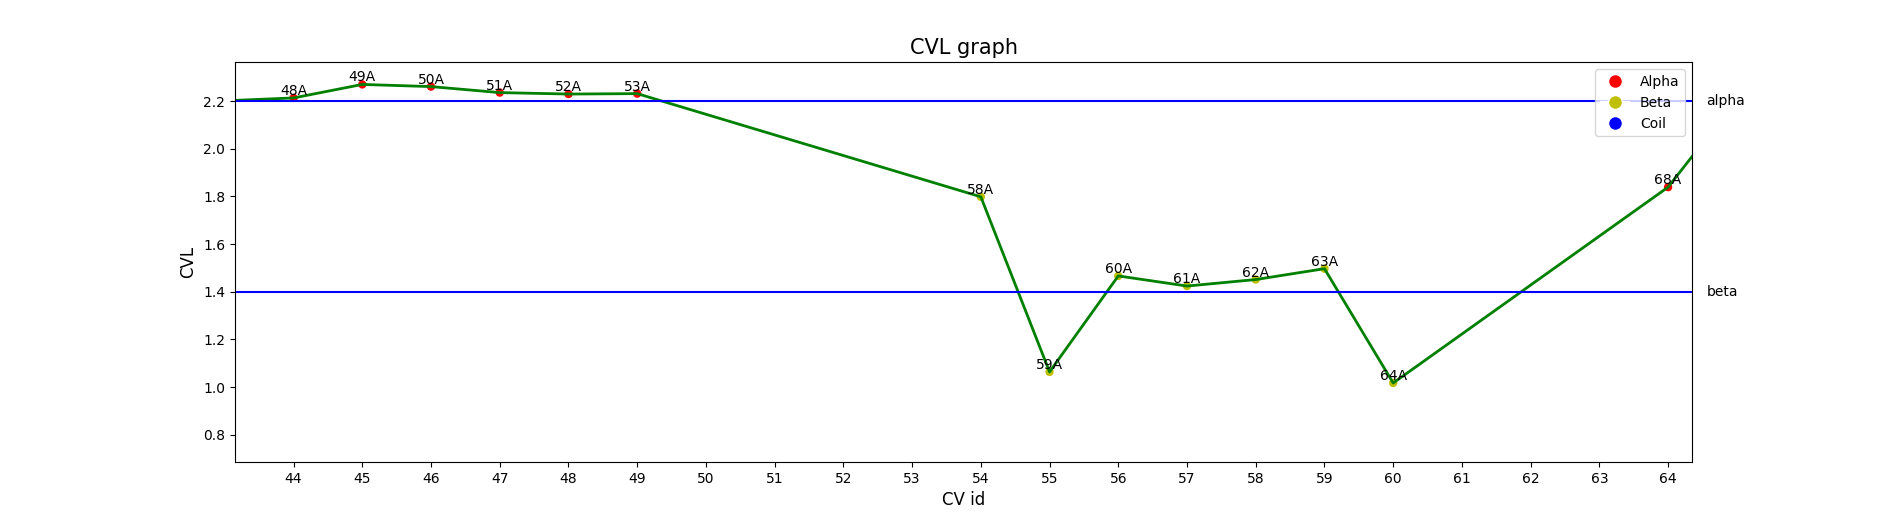
Figure 2. Distribution of CVL for amino acids 51 to 60 of 1VID. Coloured points represent ALEPH annotation and blue lines represent computed mean values for alphas and betas.
2- Decomposition of a modell
The model 1VID is decomposed using the algorithm fastgreedy and activating the packing of beta sheets. Default sensitivity parameters are used, so it is not necessary to give them in the command line.
Execution
To simplify, in this tutorial only the interactive command line is shown:
ALEPH decompose --pdbmodel 1VID.pdb --pack_beta_sheet
Outputs and results
The output model is written in 1VID_fastgreedy_disclust.pdb. The chain IDs have been set to differentiate groups formed during decomposition. Thus, displaying the file with a visualizer or through ALEPHUI and colouring by chains will show the groups (Figure 3).
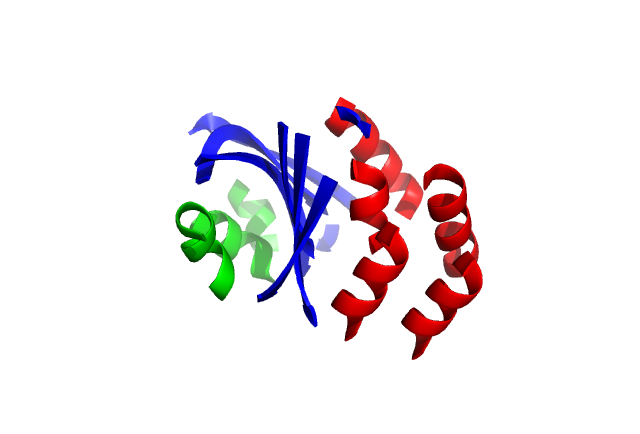
Figure 3. Cartoon representation of 1VID decomposed by ALEPH and coloured by chains.
3- Library generation
A library is generated using as template a fold extracted from 1VID. The template is a Rossmann fold composed by 46 residues, distributed in 4 parallel beta strands facing 2 alpha helices on one side. The dataset used is a subset of 143 homologs of the protein 1VID.
Execution
ALEPH generate_library --pdbmodel 1VID_2ah_4bs.pdb --directory_database homologs_1VID --score_intra_fragment 80 --score_inter_fragments 80 --rmsd_max 5.0 --representative
Outputs and results
The folder library contains the 68 models that have been extracted and superposed onto the template. The rmsd calculated between the template and each superposed model is written in the file list_rmsd.txt.
4- Superposition
In this part of the tutorial, a fragment will be superposed into an all-beta protein. The protein is the N-terminal domain of Vaccinia virus immunomodulator (PDB id 5EZU). This protein is composed of two chains, each one contains a beta sandwich of 4 beta strands. The target fragment for superposition is a fold extracted from an RNA-binding anti-termination protein (PDB id 1WPV) of a beta-sheet composed by 3 antiparallel beta strands.
Execution
ALEPH generate_library superpose --reference ../5EZU.pdb --target 1WPV_0_93.pdb --score_intra_fragment 50 --score_inter_fragments 50
Outputs and results
ALEPH determines the closest superposition, characterised by a rmsd of 0.74Å, using a core of 68 atoms.
The file with the superposed pdb (Figure 4) can be found inside the directory called library. The text file list_rmsd.txt contains the rmsd for the superposition.
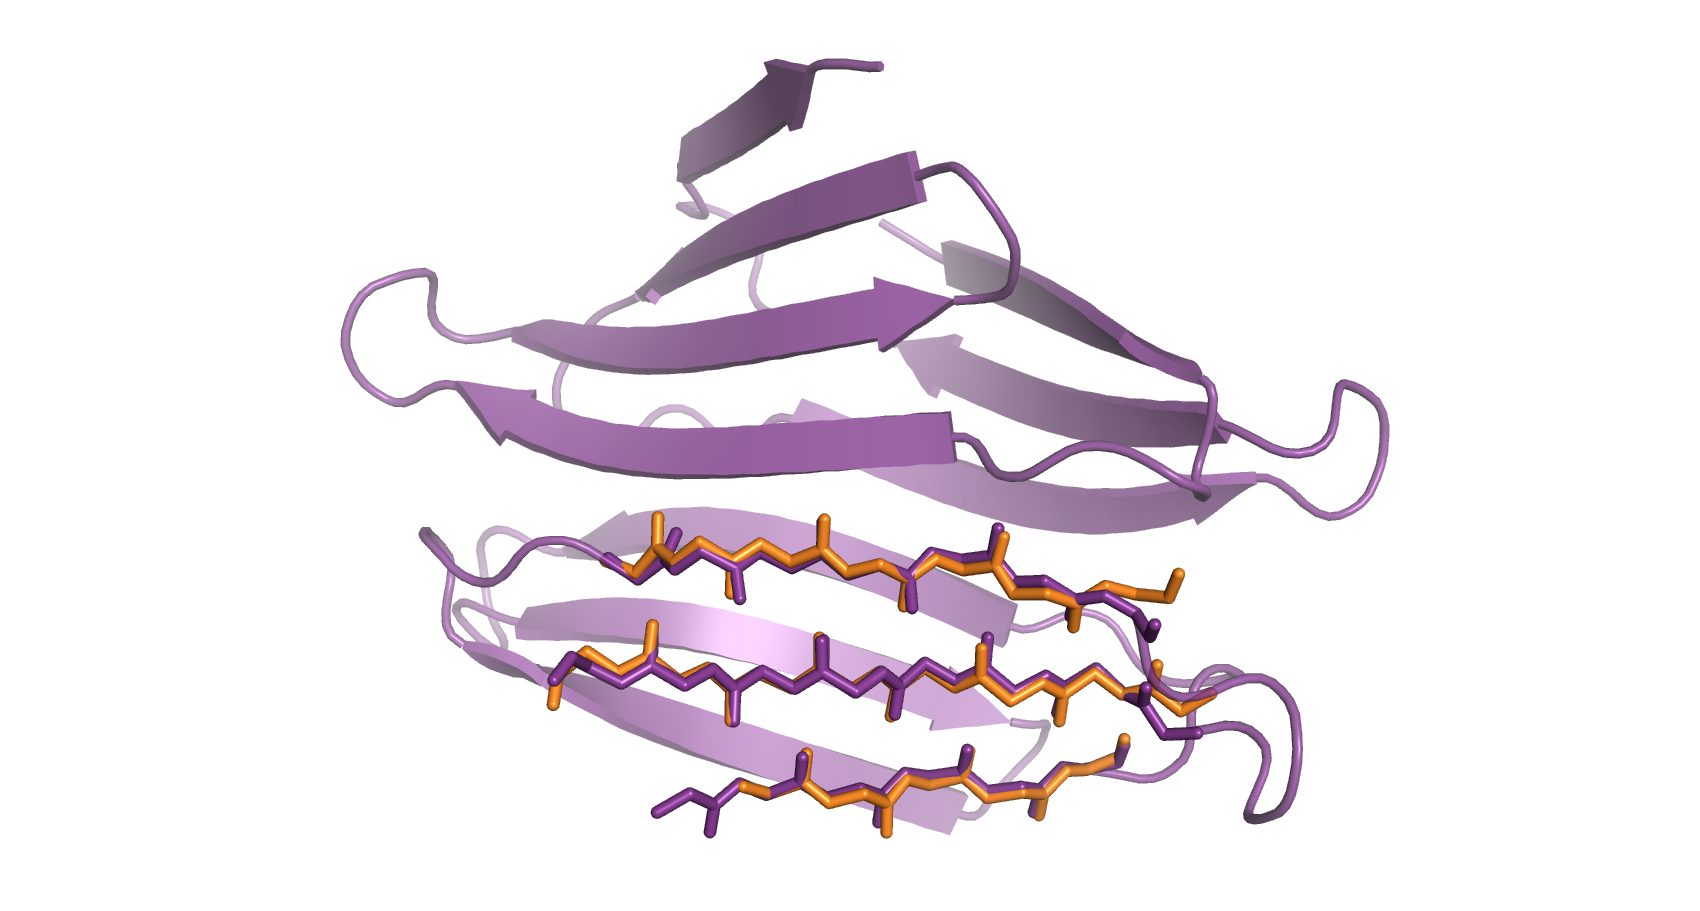
Figure 4. Cartoon representation of the reference (purple) and the superposed target (orange). The matching atoms are represented in sticks.
Download
ALEPH can be installed through the PyPI package (https://pypi.org/project/aleph/) in a Python 3 conda environment (https://docs.conda.io/en/latest/), which automatically installs all the required Python dependencies. If ALEPH is run on a grid, the conda environment should be installed in a distributed file system, visible from all nodes.